Let’s talk experimental design and analysis for today. Over the past few months I’ve been seeing a trend in how students are going from data collection to analysis. There may be a clear plan for data collection, in other words, there may have been an experimental design – but the students seem to be missing the basics in the understanding of the WHYs and HOWs of the experimental design that was put into place for their trials
Anyone who has worked with me – knows I’m a stickler for a “research question”. One of the first things I will ask anyone is “What is your research question?” It should be an easy question to answer – but for some unknown reason – it is a tough one for some to answer. Remember there’s no point in running a trial if you do not have a research question to answer – otherwise why are you spending all this time and resources collecting the data?
A research question will guide you through the steps of defining your experimental units, your treatments, and with your resources, help you decide on the best experimental design. The next tough question is often – what is your experimental unit? Sounds easy – but it can be tricky depending on your trial.
In an ideal world the experimental unit and design is decided BEFORE any data is collected. BUT… what happens when you are thrown into a trial as it is happening or after it is complete – and you do not know what the experimental design is or was? Can you still create the correct statistical model and analyze the data appropriately? I’m going to say yes! Let’s take a look at an example and see how we can work this out.
Here is the layout for a trial. Side note – I am seeing great trial layouts like this one – now we just need to work through it to come up with the CORRECT statistical model to analyze.
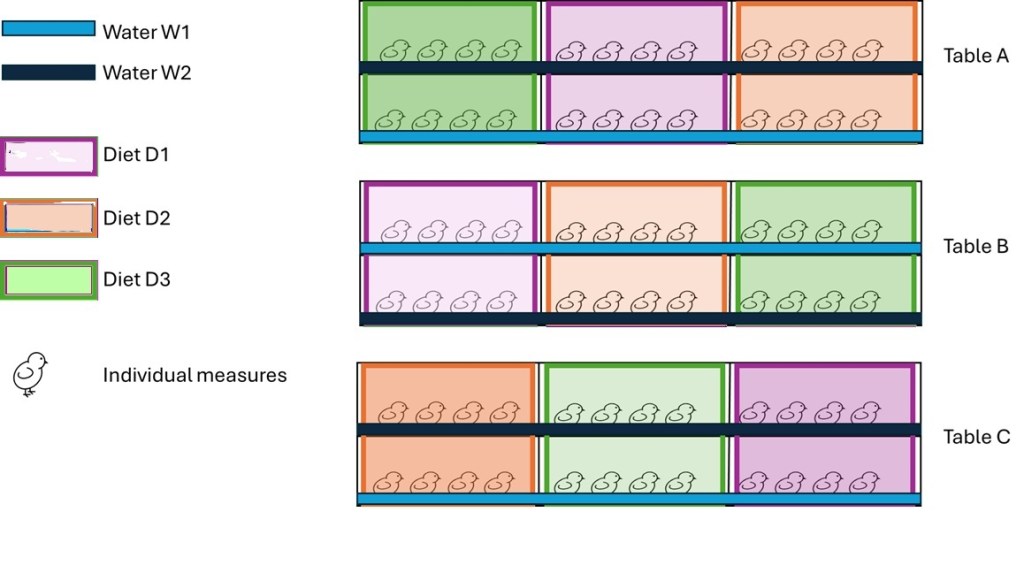
The trial shown above has 2 treatment factors: a water treatment applied to a row of cages and a diet treatment applied to a column of cages, with 4 birds in each cage and weight measurements taken on each bird. The first question that comes to my mind is: What is the experimental design? Followed by the most important question: What is the appropriate statistical model?
So – how do we handle this? The classic RCBD is not the way to go – although folks will want to take this path – I have a BLOCK (table) and I have 2 treatment factors with a bunch of measures in each – but this is INCORRECT! It all comes down to that first question: What is the experimental unit?
Identify the experimental units for each treatment factor
Why is this important? We need to identify the proper experimental units for each treatment effect in order to determine the correct error term for that treatment factor.
Use the classic question or definition of an experimental unit
- The water treatment was applied to: row of cages on a table
- The diet treatment was fed to a column of cages on a table
- The interaction between water and diet would be a cage on a table
Note that NO where does it state that EACH bird is fed or watered – it is clear that the treatments are applied to the rows and columns of cages. So – is bird your experimental unit for this trial???
Identify the error term for each experimental unit
Let’s take a little step back and think this aspect through or remind ourselves the basics on an ANOVA -Analysis of Variance! It’s NOT about finding differences – it’s about explaining or analyzing the variation of the data you collected! Explaining the total variation by partitioning into the components of your trial: water treatment, diet treatment and the interaction between the 2 factors. Once we’ve partitioned the variation or in other words explained the total variation into the component parts: the variation attributed to the water treatment effect, the diet treatment effect, and the interaction effect – then we can dig into that effect to see if there are differences among the levels of the water treatment, diet treatment, and interaction.
BUT first we need to figure out what the appropriate ERROR term is for each experimental unit. Another way to think about this is in terms of variation. Where is the variation coming from when you look at the WATER treatment factor? Remember the experimental unit for this is the ROW of cages. So – that means we have in total 2 experimental units on each table. The source of variation for W1 is the table is sits on. All 3 tables are in a room – but maybe Table C is at the back of the room and has less lighting than Table A at the front of the room. The Water treatments are applied in an identical manner on each table – so the only source of variation would the table in the room. Therefore the error term for Water would be Table x Water. You would work through the same process for the Diet factor and the interation.
From there you can work out the degrees of freedom (df) – this is always a great exercise – so when you run your analysis you can always check to ensure that it is doing what you think it’s doing 🙂
- Water: error term: table x water
- df: 2 water treatment levels across the 3 tables: 1 df for water and 2 df for tables = 1 x 2= 2 df for the error
- Diet: error term: table x diet
- df: 3 diet treatment levels across the 3 tables: 2 df for water and 2 df for tables = 2 x 2= 4 df for the error
- Water x diet interaction error term: table x water x diet
- df: 1 df for water and 2 df for diet = 1 x 2 = 2 df for water x diet interaction – across the 3 tables – gives us: 2 x 2 = 4 df for the error
Write out the Statistical model
Y = overall mean + Table + Water + Table x Water + Diet + Table x Diet + Water x Diet + Table x Water x Diet + error
Identify what is RANDOM and FIXED in your model
- Table: Random – think of this as your classic Block factor
- Water: Fixed
- Table x Water: Random
- Diet: Fixed
- Table x Diet: Random
- Water x Diet: Fixed
- Table x Water x Diet: Random
SAS or R coding
I’m going to stop here for this post – but provide you with a DUMMY dataset I created in Excel for this trial. Try it out and let me know what happened. I provide SAS and R coding in the next post and talk about the outputs as well.
I’m also thinking as a follow-up – I’ll ask ChatGPT or CoPilot to create the code and compare with what I write.


Leave a comment